At the front gate: old ore crushing equipment. This is called a "stampmill".
Back in November, I shared a couple of pictures from a trip to the Gold Reef City theme park in Johannesburg, South Africa. Over the next few weeks, I thought I would share some more pictures from a visit to this gold mine turned amusement park. My husband and I visited the theme park back in September 2012 when we were up in Johannesburg for my sister-in-law’s wedding. If you are ever in Johannesburg, I highly recommend a visit to Gold Reef City!
This week, I thought I would share a few pictures from the front entrance to the theme park. There is plenty of gold mining themed decoration!
Headed toward the front entrance gate.A wider view of the crushing equipment.A close-up shot of some of the crushers.Informational sign about the crushing equipment. Click to enlarge.Gold miner friend #1.Gold miner friend #2. Actually, this picture shows three gold miners since my husband and I work for a gold exploration company. I think our miner friend is telling us how tall we have to be in order to go on the rides.I wore my gold flake earrings, which I bought in Alaska.To the theme park!
Dassies amongst some rocks. Picture courtesy of Joy.
Last week, I shared some pictures of some dassies or rock hyraxes along the Breede River. This week, I thought I would share another picture of dassies in the Cape Town, South Africa area, courtesy of my friend Joy.
Note: Dr. Olivier Galland, a senior researcher at the Physics of Geological Processes Center of Excellence at the University of Oslo, presented a talk, “Ground deformation associated with shallow magma intrusions” at the LASI V conference in Port Elizabeth, South Africa in October 2012. The article below is based on this talk and also an interview with Dr. Galland. Over a few weeks, I am highlighting some of the research that was presented at the LASI V workshop. This is the fourth post in that series.
The landscape around an active volcano is dynamic: as magma moves about, the ground may change shape, inflating or deflating depending on how the magma is moving (Steps 1-2 of Fig. 1). The deformation may be caused either by the deep movement of magma or by the shallow intrusion of magma as sills or dykes. The movement can be dramatic (hundreds of meters) or it can be barely noticeable (a few millimeters). Big or small, ground deformation at volcanoes is important to monitor as it can provide clues to what is going on under the surface and, importantly, about when and where a volcanic eruption might occur.
At many volcanoes, geologists monitor ground deformation using a variety of techniques, including physical devices such as GPS and tiltometers, remote sensing techniques such as InSAR, and photogrammetry, which is the analysis of photographic images (Step 3 of Fig. 1). From surface measurements of ground movements, geologists can try to model what is going on underneath the surface (Step 4 of Fig. 1). However, linking observations of surface deformation to magma movements is no easy task (Step 5 of Fig. 1). That’s because geologists cannot generally directly observe the insides of a volcano. An analogy might be trying to understand why a kitchen sink is broken—why it is leaking or not flowing, perhaps— without being able to open up the cabinet door and look at the sink’s plumbing. Geologists can observe ancient volcanic plumbing, so to speak, in places where the tops of volcanoes have eroded away. However, observing the plumbing of active volcanoes is very difficult to impossible. Therefore, geologists generally rely on fancy computer models to try to link surface deformation with subsurface magma movement.
Fig. 1. Schematic diagram illustrating the principle of ground deformation analyses on active volcanoes. Numbering gives the succession of the stages of the analyses. 1. Magma intrudes in volcano, feeding magma reservoir or forming a sheet intrusion (dark gray intrusion). 2. Magma intrusion triggers ground deformation at surface, leading to modified topography (dashed line). 3. Topography variation is measured by geodetic techniques (GPS, InSAR, Photogrammetry, etc.). 4. Geodetic data are compared with modelling of ground deformation due to various intrusion shapes. 5. The best fit between models and ground deformation data provides a calculated intrusion shape (light gray dashed intrusion) responsible for the measured ground deformation. Nevertheless, the calculated intrusion shape is not a unique solution, and no direct observation is available to validate the calculation results.
Computer models are extremely helpful in trying to understand the insides of active volcanoes. However, they do have their limitations. This is because the shapes of magma chambers and shallow magma intrusions can be complex. Computer models can easily accommodate simple shapes such as circles or flat bodies. However, they have a harder time simulating more complex shapes, such as cones or saucers. Computer models also have trouble taking into account all environmental factors, such as the various stress fields and the realistic behavior of rocks. Finally, it is difficult to be completely confident in the results of computer models since the results of such models cannot generally be compared with direct observations.
One way to try to bridge the gap between surface observations of ground deformation and subsurface movements of magma inferred through computer models is through laboratory experiments. Dr. Olivier Galland is one scientist who conducts such experiments. Dr. Galland describes his experimental set-up (Fig. 2a) as, “Actually, it’s very simple. It’s just a box filled with silica flour, which is a fine-grained, granular material that is simulating the brittle crust. And into that material I inject a vegetable oil, which represents the magma, and the pressure of that oil is monitored. And then it’s possible to simulate the transport of magma and the formation of dykes and sills in this box.” Although such procedure seems simplistic, robust dimensional analysis of the method shows that the experimental results at the lab scale are valid at the geological scale.
Fig. 2. a. Drawing of the experimental apparatus. b. Representative oblique view photograph of the model surface during an experiment. The surface exhibited a smooth relief, at the rim of which the oil erupted. Dashed white line locates the section in the next image. c. Representative oblique view photograph of the model after the end of the experiment. The oil solidified and the intrusion was excavated, such that its top surface can be observed. The section showed that the intrusion was a thin sheet, resulting from hydraulic fracturing. Thus, the top surface of the intrusion was representative of its whole shape.
In a recent experiment (Galland, 2012) Dr. Galland used this silica flour and vegetable oil set up to simulate three types of shallow magmatic intrusions: a cone sheet, a dyke connected to a cone sheet, and a saucer-shaped sill. The motivation for this experiment was to provide additional data about the deformation that occurs when these shallow magmatic bodies are emplaced and, in addition, the deformation that occurs when they breach the surface and erupt. While the silica flour and vegetable oil set-up can’t simulate everything about a real volcano, it can provide plenty of important information, especially about the shapes of various intrusions and the pressures of the magma which produces these intrusions. This is possible because the oil is solid at room temperature, such that the final intrusion can be excavated out of the silica flour and its 3D shape analyzed (Fig. 2c).
Dr. Galland explains, “When a volcano is about to erupt or as it is erupted it either inflates or deflates, and this movement can be monitored. And then afterwards this movement is analyzed and inverted by geophysicists who try to calculate the geometry of the magma conduits. The problem is that we can never test these modeling results because we don’t see the intrusions because they are buried. The only way to really test these inversion techniques is to have a system where you measure the deformation and also know the shape of the intrusion and the pressure into the intrusion. And this is what we are doing in our experiments. We can quantify the shape of the intrusion and measure the pressure into the intrusion and measure the surface deformation, and then we can use this dataset to help test the inversion tools used by the geophysicists.”
Already, Dr. Galland’s experimental work is providing some interesting clues as to what is going on under the surface at volcanoes. “Recently, we figured out that there is clearly a link between how magma rises towards the surface and the pattern of the deformation at the surface,” Dr. Galland says. “Interestingly, this pattern develops very early during the experiments in the very early stages. So, we can observe some asymmetric development of this pattern which indicates where the magma is rising. So, if we can analyze that in real time, we could theoretically use it to predict where an eruption will occur. Obviously, in terms of volcanic hazard that is very important.” This is illustrated in the Figure 3, which shows the good match between the shape of the intrusion with the resulting ground deformation.
Fig. 3. Correlation between the shape of the ground deformation and the underlying intrusion in a characteristic experiment. a. Topographic map of model surface before the eruption of the oil. b. Plots of the temporal evolution of topographic profiles across the ground deformation pattern. The profiles are located on the map described in a. Each curve of the plots represents a transient stage of the model surfaces during each experiment. One can notice an initial symmetrical ground deformation, evolving to asymmetrical. c. Topographic map of the top surface of the excavated intrusion. The grey scale indicates the depth in mm below the initial surface. The locations of topographic profiles are the same as on the map of model surface in a, such that the profiles of the ground deformation and of the intrusions can be compared. d. Plots of topographic profiles of the model surface (top) and the underlying intrusion (down) parallel to the X-axis (X-profile). e. Plots of topographic profiles of the model surface (top) and the underlying intrusion (down) parallel to the Y-axis (Y-profile). Notice the vertical scale dilation for the profiles of the model surface. The correlation between e and d show that the ground deformation pattern reflects the shape of the underlying intrusion. This suggests that the asymmetrical development of the ground deformation pattern can be analysed to predict where the magma rises towards the surface.
However, Dr. Galland doesn’t spend all of his time in the laboratory. He believes that it is important for him to regularly go into the field to directly observe volcanoes, modern and ancient. He is particularly interested in observing subvolcanic systems, such as the saucer-shaped sills exposed in South Africa’s Karoo region and intrusive complexes formed in compressional settings exposed in the Neuquén Basin in the north Patagonian Andes. Dr. Galland explains, “My approach is to go to the field and really observe and do some detailed work and then out of that comes a question and then these questions can be subsequently addressed with experiments.” After all, that field knowledge is important for turning silica flour into the Earth’s crust and vegetable oil into magma.
Reference:
Galland, O. 2012. Experimental modelling of ground deformation associated with shallow magma intrusions. Earth and Planetary Science Letters, Vol. 317-318: 145-156.
***Note: Thanks very much to Dr. Galland for providing the three figures and captions.***
Uplifted sandstone rocks along the Breede River near Robertson, South Africa, February 2013.
This past weekend my husband and I traveled down to Robertson, South Africa to visit family. We’ve been wanting to do a river trip for awhile, so we booked a kayaking trip along the Breede River for Saturday. The Breede is a very beautiful river, and we saw some incredible birds– most of which flew away before we could take a good picture of them! We stopped for a snack and some swimming near the uplifted (nearly vertical!) sandstone rocks in the above picture. We were taking a look at the rocks when we noticed some movement amongst them.The rocks, as it turned out, were full of dassies or rock hyraxes. The dassies kept darting out from the rocks and hopping and waddling (they’re pretty fat!) down to the river for a drink on the hot summer day.
Coral exposed at the university outcrop. You can tell geologists have been here! Barbados, June 2009.
For this week’s Monday Geology Picture post, I thought I would share a few more pictures from my class field trip to Barbados back in 2009. One day we visited a well-known coral outcrop located adjacent to the University of the West Indies. You could tell that geologists had been there before by all the drill holes!
Corasl exposed at the university outcrop, Barbados, June 2009.More drill holes in coral at the university outcrop, Barbados, June 2009.The University of the West Indies, Barbados, June 2009.
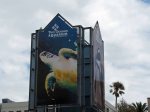
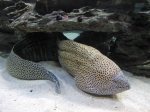
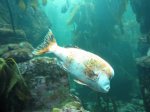
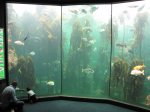
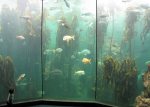
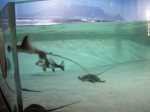
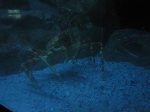
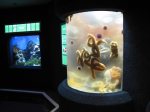
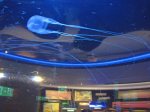
Today my husband and I visited the Two Oceans Aquarium in Cape Town, South Africa. I highly recommend a visit to the aquarium for anyone in the area. Below is a gallery of a few pictures from our visit. Enjoy! Click on any of the pictures below for a larger version.
Brown and black products of Quaternary glaciovolcanic activity, with Paleozoic granite in the background, northern Victoria Land Antarctica. John Smellie for scale. Photo Credit: National Antarctic Research Program of Italy.
Note: Dr. Sergio Rocchi, an associate professor at the University of Pisa in Italy, presented a talk, “Intravolcanic sills, lava flows, and lava-fed deltas (Victoria Land, Antarctica): Paleoenvironmental Significance” at the LASI V workshop in Port Elizabeth, South Africa in October 2012. The article below is based on this talk and also an interview with Dr. Rocchi. Over a few weeks, I am highlighting some of the research that was presented at the LASI V workshop. This is the third post in that series.
When volcanoes erupt underneath and in the vicinity of glaciers and ice sheets, a unique geological record is created that provides information about both the volcanism and the snow and ice which interacted with the lava as it was being erupted. “Glaciovolcanism” is the term used to describe the interaction of lava with ice, snow (in all its forms, such as “firn” or compacted snow), and meltwater.
Glaciovolcanism includes study of modern examples in places such as Iceland and Antarctica as well as study of ancient examples. For the ancient examples, the ice and snow have generally long since melted away as a result of changing climate over the ages. Furthermore, the sediments and sedimentary rocks—tills and moraines and diamicts— associated with the glaciers and ice sheets have also often long since eroded away. However, volcanic rocks which interacted with the ice and snow are harder and slower to erode, and they often remain long after ice and sediment have disappeared.
Dissected late Pliocene volcano, northern Victoria Land Antarctica. John Smellie for scale. Photo Credit: National Antarctic Research Program of Italy.
Glaciovolcanic rocks can provide much valuable information about ancient glaciers and ice sheets. For example, study of glaciovolcanic rocks can help geologists identify if ice was present and, if so, can help geologists learn about the thickness of the ice, the elevation where the ice was present, the temperature conditions at the base of the ice, and the structure of the ice. A limitation is that volcanic eruptions do not occur continuously. Depending on the circumstances, they may occur at intervals of 10s—or even of 100s or 1000s— of years. Also, over time even hard glaciovolcanic rocks can erode away. Nevertheless, study of glaciovolcanic rocks is a powerful tool for reconstructing past ice cover and conditions, which in turn provides much information about past climate that can complement other paleoclimate studies—for example, study of sedimentary and coral records. Volcanic rocks are also fairly easy to date using isotopic techniques, so they can provide clear age constraints to help with paleoclimatic reconstructions.
Dr. Sergio Rocchi is a volcanologist who has studied glaciovolcanic rocks in Antarctica along with his colleague Dr. John Smellie and other co-workers. Dr. Rocchi explains, “Volcanic eruptions in subglacial environments generate some glacial volcanic lithofacies [units of rocks with certain characteristics] which can tell us the thickness and also the type of ice that was present at the time of the eruption. Additionally, the volcanic rocks can be dated by isotopic means, so the combination of the age and thickness of the ice can be a very useful source of paleoenvironmental information.”
Sergio Rocchi flying over Mt Melbourne Volcano, northern Victoria Land Antarctica. Photo credit: National Antarctic Research Program of Italy.Sergio Rocchi over Campbell Glacier, northern Victoria Land Antarctica. Photo credit: National Antarctic Research Program of Italy.
As an example, Dr. Rocchi and his co-workers have studied Late Miocene glaciovolcanic rocks of Victoria Land, Antarctica. There, hyaloclastite-rich glaciovolcanic rocks, including some “lava-fed deltas” (features which form when lava enters water either in a marine/lacustrine or a glacial meltwater environment), have enabled reconstruction of Late Miocene glacial cover over Victoria Land. The glaciovolcanic rocks indicate that at this time Victoria Land was covered by a thin (<300 m thick) cover of ice. This ice sheet is much thinner than that predicted by some modeling studies and implies a more complex climatic transition in the Miocene than previously thought.
While most work regarding glaciovolcanism to date has been carried out in Antarctica, study of glaciovolcanism can also be done in many other places. “Similar work can obviously been done wherever there are or were volcanoes and ice,” says Dr. Rocchi. “The main places where volcano-ice interaction can be studied are Antarctica, Iceland, and British Columbia in the northern Cascades. A future project for which we are raising funding is making a comparison of the glaciovolcanic record in Antarctica with that in Iceland.”
In the future, study of glaciovolcanism will no doubt continue to help geologists and climate scientists unravel the history and nature of past glaciers and ice sheets. Combined with other paleoclimate records, study of glaciovolcanism will help scientists to better understand how Earth’s climate used to be and how climate changes over time. This information is invaluable in a time when humans are experiencing the effects of anthropogenic climate change and when scientists need as much information as possible in order to evaluate what may happen to Earth’s climate in the coming years.
Smellie, J., Wilch, T., and Rocchi, S., 2013. ‘A‘ā lava-fed deltas: A new reference tool in paleoenvironmental studies. Geology. (to be published in the April issue).
Smellie, J., Rocchi, S., and Armienti, P. 2011. Late Miocene volcanic sequences in northern Victoria Land, Antarctica: products of glaciovolcanic eruptions under different thermal regimes. Bulletin of Volcanology, Vol. 73: 1-25.
Smellie, J., Rocchi, S., Gemelli, M., Di Vincenzo, G., and Armienti, P. 2011. A thin predominantly cold-based Late Miocene East Antarctic ice sheet inferred from glaciovolcanic sequences in northern Victoria Land, Antarctica. Palaeogeography, Palaeoclimatology, Palaeoecology, Vol. 307: 129-149.
Smellie, J., Johnson, J., McIntosh, W., Esser, R., Gudmundsson, M., Hambrey, M., van Wyk de Vries, B. 2008. Six million years of glacial history recorded in volcanic lithofacies of the James Ross Island Volcanic Group, Antarctica Peninsula. Palaeogeography, Palaeoclimatology, Palaeoecology, Vol. 260: 122-148.
A green sea turtle in a turquoise sea, Barbados, June 2009.
When I was back in Barbados for a student field trip back in 2009, I caught sight of a beautiful sea turtle one day. I didn’t have a very good camera back then, so I didn’t take a great picture of the turtle. The picture may not do the moment justice, but I still recall how magical it felt to observe a beautiful green sea turtle in a turquoise sea. Of course, being geologists we were at the beach to look at some rocks, which were pretty beautiful as well.
A closer view of the sea turtle, Barbados, June 2009.The rocks beyond the turtle, Barbados, June 2009.More rocks, Barbados, June 2009.
I thought I would continue with a few more posts from Alaska.
My husband and I were in Nome, Alaska during July – September 2012. On sunny (and some stormy) days we were generally working. However, on days with poor weather and high seas or winds, we often had some time to explore Nome and the surrounds. One day, we drove up the road to visit The Last Train to Nowhere, a set of three 1880s era steam locomotives that were brought to the Solomon River area outside of Nome in the early 1900s. These locomotives and a few other scattered pieces of metal are all that remains of a failed attempt to build a railway along the Solomon River to a place called Council City, where gold had been discovered. The railway ran for two summers under terrible conditions “unfit for either man or beast” (according to a sign near the trains) and then filed for bankruptcy in 1907. In 1913 a large storm destroyed a railway bridge and washed away most of the tracks, stranding the locomotives where they sit today. Since the train doesn’t go anywhere today, locals have dubbed the stranded locomotives, “The Last Train to Nowhere.”
To reach the train, we drove along a dirt road in a beat-up pick-up truck on a cold and windy August day. Along the way, we also visited a place called “The Safety Roadhouse”, which serves as the last checkpoint of the Iditarod sled dog race, and we explored some old gold dredges.
The Last Train to Nowhere #2.The Last Train to Nowhere #3. An informational sign about the train.Another informational sign about the train.Posing with the train. Yes, I am wearing two jackets and a hat in August!Last Train to Nowhere #4.Last Train to Nowhere #5.Last Train to Nowhere #6, with husband for scale.Another abandoned item near the train. This looks like a ship's hull, but we think it used to be part of a water tower.Waving through a window.Continuing up the road past the train, we found some weathered, old buildings.An abandoned gold dredge.A closer view of the dredge.Waterlogged dredge buckets.Another view of the dredge buckets.Remnants of winter snow along the road.An Alaskan flag, flapping in the wind.The Safety Roadhouse, located on Safety Sound.The walls inside the roadhouse are covered in dollars and other bills.The ceiling is covered, too...We added a South Africa R10 note... next to one left previously by some colleagues of ours.
I still have a few more posts about Alaska coming in the future… hope you’re enjoying these!
A coral outcrop in someone's backyard in Barbados, June 2009.
If you live in Barbados, don’t be surprised if one day a group of geologists shows up in your backyard… especially if there are coral rocks in your backyard, which is likely considering how much coral, both modern and fossil, is found on Barbados.
Another view of the backyard coral outcrop, Barbados, June 2009.A group of geologists gathered around the backyard coral outcrop, Barbados, June 2009.A student taking a closer look at the backyard coral outcrop, Barbados, June 2009.