|
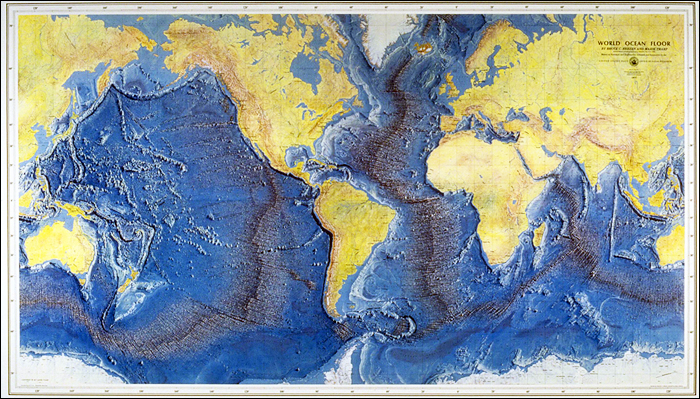
| The 1977 World Ocean Floor Map created by Bruce Heezen and Marie Tharp. Image taken from here. |
One of the most famous world maps is the 1977 World Ocean Floor Map (see above) created by Bruce Heezen and Marie Tharp, a pioneering female oceanographer and kick-ass female scientist. Prior to the publication of this map, scientists had very little idea of what the seafloor looked like on a global scale.
Although the concepts of mid-ocean ridges and plate tectonics seem innate to the work of oceanographers and geochemists today, these concepts are remarkably recent in their development. Plate tectonics was not fully accepted by the scientific community until the late 1960s and early 1970s, and this first great seafloor map was not published until the late 1970s. Mid-ocean ridges were not discovered until the work of Heezen and Tharp in the 1950s and 1960s.
To this day, scientists still know relatively little about the seafloor. Modern technology is making mapping the seafloor easier, but to obtain detailed information one really must go out in a boat and take many days to carefully study a section of seafloor. Research cruises to map the seafloor are expensive and not always practical. Remote sections of the ocean or places where there is bad weather are difficult to impossible to map. Geologists actually know more about the topography of the moon and other terrestrial planets, such as Mars, than they know about the topography of Earth’s own ocean floor.
Prior to the pioneering work of Heezen and Tharp, almost nothing was known about the topography of the seafloor. The advent of new technologies to study bathymetry and the dedicated work of Heezen, Tharp, and other oceanographers shed some light on the dark, unknown ocean floor. Tharp carefully mapped the Atlantic ocean and discovered the Mid-Atlantic Ridge, a giant chain of mountains running along the middle of the ocean. At first, no one believed Tharp’s discovery of mid-ocean ridges. In the days before plate tectonic theories had been worked out and generally accepted, having a giant mountain chain in the middle of an ocean didn’t make much sense. There was no obvious reason why such a mountain chain should occur in the middle of an ocean.
Later, scientists realized that such ridges made perfect sense: mid-ocean ridges represent places where two oceanic plates are moving apart and new oceanic crust is forming from volcanic eruptions. At a mid-ocean ridge, the young, hot lava is bouyant and creates a topographic high. As the oceanic crust moves away from the ridge and ages, it cools and becomes more dense. The crust contracts and also sinks lower into the mantle, creating a topographic low. Thus, the ocean is shallower at mid-ocean ridges and deeper in the middle of oceans and also at subduction zones, places where the oldest, densest oceanic crusts subducts underneath lighter continental crust.
The famous 1977 seafloor map of Heezen and Tharp was a revolutionary map for the worldview of oceanographers. All of a sudden, oceanographers had an elegant, dramatic picture of the mid-ocean ridges running through the world’s oceans like seams on a baseball. The map made sense in the framework of the young science of plate tectonics.
Although new data on the seafloor has been collected using modern techniques such as multibeam bathymetry (bouncing waves off the bottom of the ocean to calculate topography) and satellite altimetry (using the height of ocean waves to look for gravity anomalies and infer the topography below), the 1977 Heezen and Tharp map is still remarkably accurate, especially considering they made up (honestly– they didn’t deceive anyone) parts of the map where they had no data.
Heezen and Tharp’s 1977 seafloor map is also remarkable for its aesthetic beauty. The map was actually painted by a famous landscape and panorama artist named Heinrich Berann, a very talented Austrian painter. Berann masterfully captured the dramatic mountain ranges of the mid-ocean ridges in his painting.
Bruce Heezen died many years ago, and Heinrich Berann died a few years back. Marie Tharp just died in 2006 at the age of eighty-six. Here’s to a great female oceanographer and scientist. I hope that my career in oceanography has a tenth of the influence Marie’s career did.
 |
| Bruce Heezen and Marie Tharp. Image from Wikipedia Commons. |
 |
| Marie Tharp in 2001. From Columbia University Website here. |